It’s time for another Traktip!
One of the many great features of Issuetrak is its dashboard, allowing you to view at-a-glance data on open and closed issues, response times, tasks, and more. But how can you customize that dashboard to be sure you’re seeing exactly what you need to see every time? We’ll walk you through the process, step by step.
How to Add Panels to the Dashboard
Adding panels allows you to select and organize the information you see as soon as you load up the Issuetrak dashboard. You can have as many or as few panels on your dashboard as you'd like, and those panels can either immediately expand upon opening the page or remain collapsed until you manually expand them.
1. In the left-hand menu, select "Dashboard."
2. On the right side of the screen, you'll see a "Dashboard settings." Click the hyperlinked text.
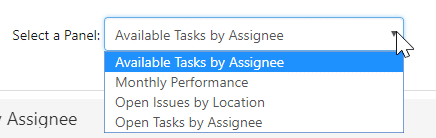
3. You will see a page with your current dashboard layout displayed. Navigate to the top center of the page and click the drop-down menu. Choose the panel that you would like to add.
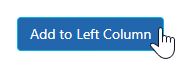
4. Click “Add to Left Column” or “Add to Right Column” based on where you would like the panel to appear on your dashboard. You can add as many panels as you want on either side.
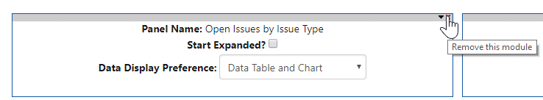
5. Choose whether to start the panel expanded. This will display all of your data for this chart as soon as you load the dashboard (instead of needing to click to reveal the panel).
6. Choose whether the panel will display only the Data table, only the Chart, or both the Table and the Chart by selecting from the “Data Display Preference” drop down menu.
7. Click the “Save” button in the lower left hand corner of the screen to save your changes.
How to Delete a Panel
- Navigate back to "Dashboard settings."
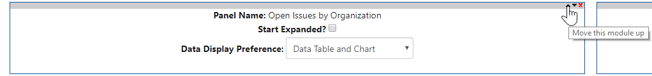
- Select the bright red “X” in the upper right hand corner of the panel that you would like to delete from your dashboard.
- Select either "Set as My Dashboard," "Set as Default," or "Reset" from the bottom left.
How to Rearrange Panels
- Navigate back to "Dashboard settings."
- Select the up/down arrow in the upper right hand corner of the panel that you want to rearrange. Clicking the arrow will move the panel in the same direction it’s pointing.
- Select either "Set as My Dashboard," "Set as Default," or "Reset" from the bottom left.
Once you have your dashboard laid out exactly the way you want it, you can return to the Dashboard tab to see your displayed data:
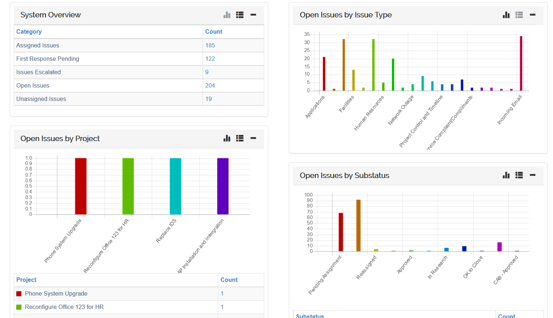
As you begin adding issues and tasks and otherwise interacting with your Issuetrak site, these graphs and tables will populate with more data. The dashboards will display with a default rainbow color.
If you would like to change the color of the dashboard bars you must have administrative permissions enabled. If you have those permissions, click the top right gear icon to populate the settings lightbox. Choose System Colors which is located under System. A new page will open where you can adjust the colors and saturation levels from this control panel.
As always, if you have any questions, don’t hesitate to contact your Account Manager or call our Support team at 757-213-1351. We’re happy to help!
Topics from this blog: Traktips
Back